Calculating standard deviation in Excel is essential for measuring data variability and spread. Excel provides multiple standard deviation functions: STDEV.S for sample data (most common), STDEV.P for population data, and legacy functions STDEV/STDEVP. This complete guide covers all Excel standard deviation formulas, when to use each function, and step-by-step examples with interpretations.
Use =STDEV.S(range) for sample standard deviation or =STDEV.P(range) for population standard deviation. Download the practice Excel file from the sidebar to follow along with real examples.
Quick Reference: Excel Standard Deviation Formulas
| Function | Use For | Syntax | Example |
|---|---|---|---|
| STDEV.S | Sample (most common) | =STDEV.S(range) | =STDEV.S(A2:A50) |
| STDEV.P | Population | =STDEV.P(range) | =STDEV.P(A2:A50) |
| STDEVA | Sample + logical values | =STDEVA(range) | =STDEVA(A2:A50) |
| STDEVPA | Population + logical values | =STDEVPA(range) | =STDEVPA(A2:A50) |
Table 1: Standard deviation functions available in Excel with syntax and use cases
Use STDEV.S for 95% of cases - it's the correct choice when working with sample data from a larger population.
If you're unclear about the difference between population and sample standard deviation, read that guide first to understand which formula applies to your data.
Understanding Standard Deviation Formulas
Standard deviation measures how much individual values deviate from the mean (average). Two different formulas are used depending on whether your data represents:
- Sample (n) - A subset of a larger population
- Population (N) - The entire group you're studying
Population Standard Deviation Formula
The population standard deviation (σ) is used when you have data for the entire population:
Where:
- σ = population standard deviation
- Σ = sum of the following terms
- xi = each value in the dataset
- μ = population mean
- N = total number of values in the population
Sample Standard Deviation Formula
The sample standard deviation (s) is used when you have data from a sample of a larger population:
Where:
- s = sample standard deviation
- Σ = sum of the following terms
- xi = each value in the sample
- x̄ = sample mean
- n-1 = degrees of freedom (Bessel's correction)
The key difference is dividing by n-1 instead of N to correct for bias when estimating population parameters from sample data.
How to Calculate Population Standard Deviation in Excel
Excel provides two functions for calculating population standard deviation:
STDEV.P Function
The STDEV.P function calculates the population standard deviation and automatically ignores text and logical values (TRUE/FALSE).
Syntax:
=STDEV.P(number1, [number2], ...)
Example:
Suppose you have data for an entire population in cells C2:C11. Here's how to calculate the population standard deviation step-by-step:
Step 1: Access the Insert Function dialog by clicking the "fx" button or pressing Shift+F3.
Step 2: Type "STDEV.P" in the search field and click Go, then select STDEV.P from the list:
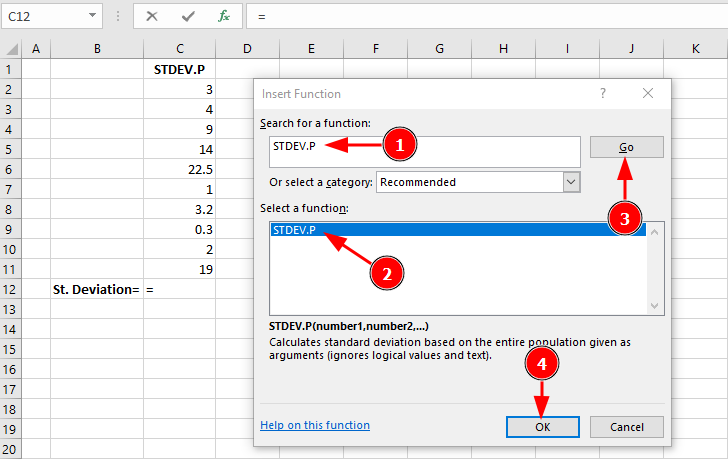
Figure 1: Searching for and selecting the STDEV.P function in Excel
Step 3: In the Function Arguments dialog, select your data range (C2:C11):
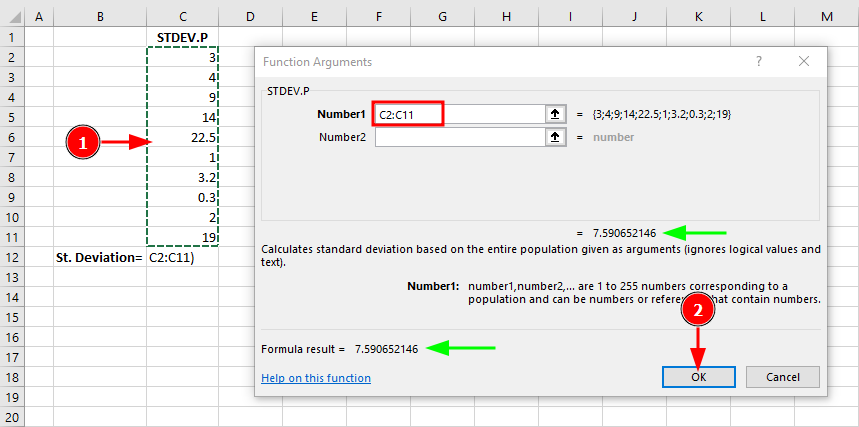
Figure 2: STDEV.P Function Arguments dialog with data range and result
Step 4: Click OK to see the final result:
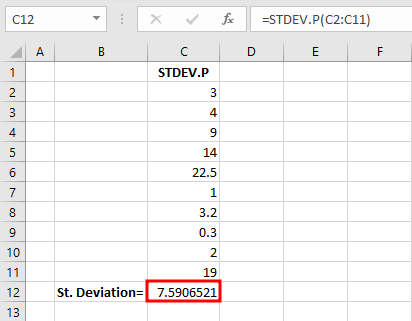
Figure 3: Completed STDEV.P calculation showing population standard deviation
The function returns 7.59 as the population standard deviation, showing how spread out the values are from the mean.
STDEVPA Function
The STDEVPA function also calculates population standard deviation but includes text and logical values:
- Text and FALSE = 0
- TRUE = 1
Syntax:
=STDEVPA(value1, [value2], ...)
Example:
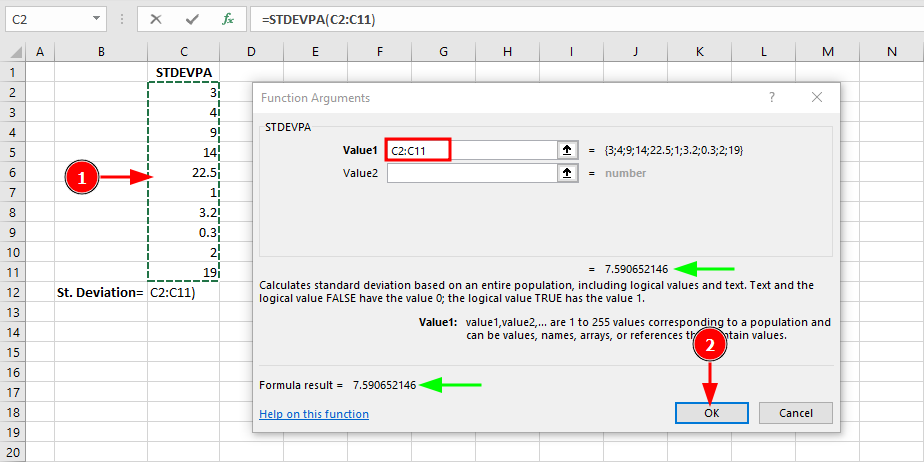
Figure 4: STDEVPA function includes logical values and text in the calculation
Use STDEVPA when your dataset intentionally includes logical values you want counted in the calculation. In this example, since the dataset contains only numbers, STDEVPA returns the same result as STDEV.P (7.59).
How to Calculate Sample Standard Deviation in Excel
For most real-world scenarios, you're working with a sample (not the entire population). Excel provides two functions for sample standard deviation:
STDEV.S Function (Most Common)
The STDEV.S function calculates the sample standard deviation and is the most commonly used function. It ignores text and logical values.
Syntax:
=STDEV.S(number1, [number2], ...)
Example:
Here's how to calculate sample standard deviation using the same dataset (C2:C11), which now represents a sample from a larger population:
Step 1: Access the Insert Function dialog and search for "STDEV.S":
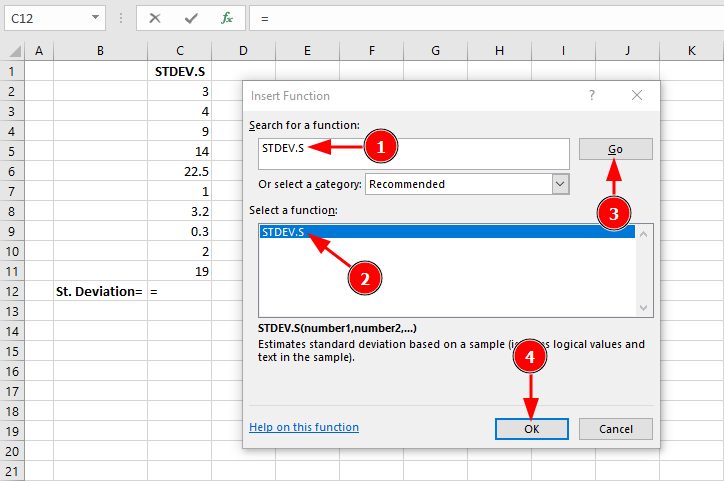
Figure 5: Selecting STDEV.S function for sample standard deviation
Step 2: In the Function Arguments dialog, select your data range:
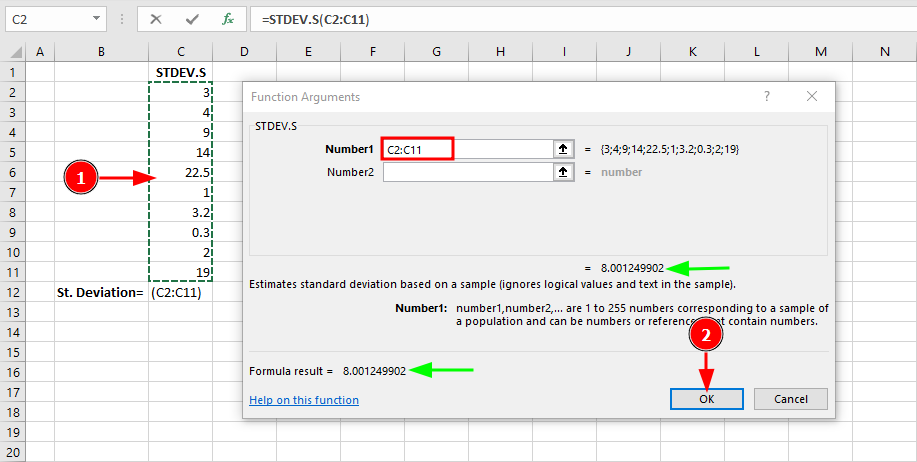
Figure 6: STDEV.S returns 8.00 (higher than STDEV.P due to Bessel's correction n-1)
Notice the result is 8.00 for the sample standard deviation, compared to 7.59 for the population standard deviation. This difference is due to Bessel's correction (dividing by n-1 instead of N), which provides an unbiased estimate when working with sample data.
This is the default choice for most statistical analysis when working with sample data.
STDEVA Function
The STDEVA function calculates sample standard deviation but includes text and logical values:
- Text and FALSE = 0
- TRUE = 1
Syntax:
=STDEVA(value1, [value2], ...)
Example:
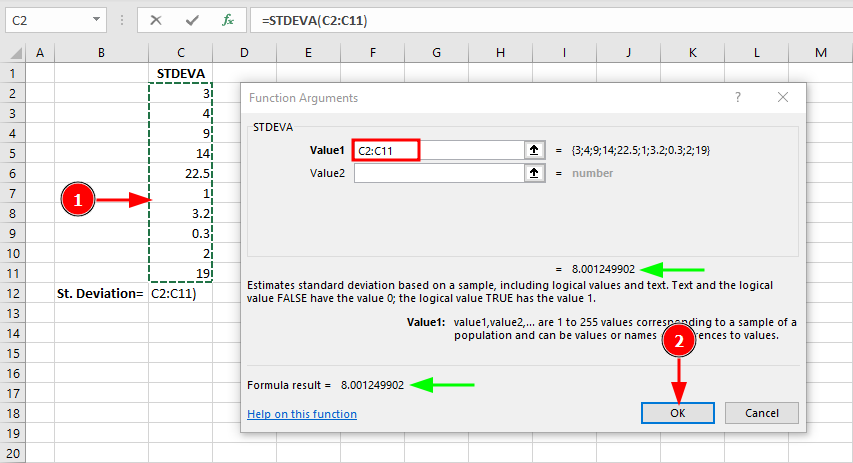
Figure 7: STDEVA function includes logical values and text in sample standard deviation calculation
Use STDEVA only when you specifically need to include logical values in your calculation. In this example with purely numeric data, STDEVA returns the same result as STDEV.S (8.00).
Legacy Standard Deviation Functions
Excel also includes older functions for backward compatibility:
| Legacy Function | Modern Equivalent | Use Case |
|---|---|---|
| STDEV | STDEV.S | Sample standard deviation |
| STDEVP | STDEV.P | Population standard deviation |
Table 2: Legacy and modern standard deviation function equivalents
Recommendation: Always use the modern functions (STDEV.S, STDEV.P) as they're more explicit about whether you're calculating sample or population standard deviation.
Which Standard Deviation Function Should You Use?
Here's a quick decision guide:
Use STDEV.S when:
- Working with a sample from a larger population (most common case)
- Conducting surveys, experiments, or sampling studies
- You have a subset of data representing a larger group
- Example: Test scores from 30 students out of 500 total students
Use STDEV.P when:
- You have data for the entire population
- Your dataset includes every single member of the group
- Example: Test scores for all 30 students in a complete class
Use STDEVPA/STDEVA when:
- Your dataset intentionally includes TRUE/FALSE or text values
- You want these values counted as 1 and 0 respectively
Rule of thumb: If you're unsure, use STDEV.S (sample). It's the statistically conservative choice and appropriate for most analyses.
Step-by-Step Example: Calculating Standard Deviation
Let's work through a complete example calculating standard deviation for monthly sales data.
Dataset: Monthly sales figures (in thousands) for 12 months
| Month | Sales |
|---|---|
| Jan | 45 |
| Feb | 52 |
| Mar | 48 |
| Apr | 61 |
| May | 55 |
| Jun | 49 |
| Jul | 58 |
| Aug | 63 |
| Sep | 51 |
| Oct | 47 |
| Nov | 54 |
| Dec | 59 |
Table 3: Monthly sales figures (in thousands) for the calculation example
Step 1: Enter your data in Excel (cells B2:B13)
Step 2: Calculate the mean using =AVERAGE(B2:B13)
Result: 53.5
Step 3: Calculate sample standard deviation using =STDEV.S(B2:B13)
Result: 5.9
Interpretation: The average monthly sales are 53.5 thousand, with a standard deviation of 5.9 thousand. This means most months fall within about 6 thousand of the average (roughly between 47.6 and 59.4 thousand).
Related Excel Statistical Functions
VAR.S and VAR.P (Variance)
Variance is the square of standard deviation. Excel provides variance functions that work similarly:
=VAR.S(number1, [number2], ...)  // Sample variance
=VAR.P(number1, [number2], ...)  // Population variance
The relationship: Standard Deviation = √Variance
Learn more about variance and other descriptive statistics in Excel.
AVEDEV (Average Deviation)
The AVEDEV function calculates the average of absolute deviations from the mean:
=AVEDEV(number1, [number2], ...)
Similar to standard deviation, a large average deviation indicates high spread around the mean, while a low value indicates low dispersion. Unlike standard deviation which squares the deviations, AVEDEV uses absolute values, making it less sensitive to extreme outliers.
Interpreting Standard Deviation Results
Understanding what your standard deviation value means:
Small Standard Deviation (close to 0):
- Data points cluster tightly around the mean
- Low variability
- Values are consistent and predictable
- Example: SD = 2 for test scores averaging 85 means most scores are between 83-87
Large Standard Deviation:
- Data points are spread out from the mean
- High variability
- Values are less consistent
- Example: SD = 15 for test scores averaging 85 means scores range widely (70-100)
In a normal distribution:
- ~68% of values fall within 1 standard deviation of the mean
- ~95% of values fall within 2 standard deviations
- ~99.7% of values fall within 3 standard deviations
For more on measures of central tendency and spread, see our guide on calculating mean, median, and mode.
Common Mistakes to Avoid
1. Using STDEV.P for sample data
- This underestimates variability in your sample
- Always use STDEV.S when working with samples
2. Including headers in your range
- STDEV.S will return an error if text headers are included
- Select only numeric data cells
3. Mixing sample and population formulas
- Be consistent: sample data requires sample formulas throughout your analysis
4. Ignoring outliers
- Extreme values significantly affect standard deviation
- Consider removing outliers or using median/IQR for skewed data
Frequently Asked Questions
Wrapping Up
Calculating standard deviation in Excel is straightforward once you understand which function to use. For most analyses involving sample data, STDEV.S is your go-to function, while STDEV.P is reserved for complete population datasets.
Understanding standard deviation is crucial for analyzing variability in your data and forms the foundation for more advanced statistical analyses. Combined with mean, median, and mode, standard deviation gives you a complete picture of your data's distribution.
Practice with the downloadable Excel file to build confidence in calculating and interpreting standard deviation for your own datasets. For more Excel statistical tools, explore our guide on adding the Data Analysis ToolPak.