In this comprehensive tutorial, you'll learn how to calculate standard error in Excel, SPSS, and R with step-by-step examples and downloadable datasets. Whether you need to find standard error in Excel using formulas, calculate standard error in SPSS with descriptive statistics, or compute it in R, this guide covers everything you need.
We'll cover the standard error formula, its interpretation, and practical calculations across all three platforms with real examples.
Note: The terms "standard error" and "estimated standard error of the mean" are used interchangeably in statistics and refer to the same concept.
What is the Standard Error of the Mean
In an ideal scenario, researchers would have access to entire populations for their studies. However, this is rarely feasible in practice.
In most cases, we collect data by sampling the population we investigate. If we take multiple samples of the same population we will observe that they are slightly different.
For instance, the mean of each sample will be different from another as each sample likely contains different members of the same population.
So how do we know if sample data represent a whole population?
This is where the standard error of the mean (or simply, standard error) becomes essential. Here are the common notations used by various authors in the literature:
The standard error is used to determine how close the mean of a sample taken from a population is compared to the average value of the true population.
A lower standard error value shows that the sample means have a close distribution around the population mean therefore more representative of the true population.
In contrast, a higher standard error value likely shows that the sample is an inaccurate representation of the true population.
The best way to lower a high standard error value is by increasing the sample size. We will do a comparison later in this lesson.
It is also important to use random sampling when collecting the data to avoid sampling bias.
Finally, you should really understand the **difference between the standard error of the mean and standard deviation**in statistics. The two are often a source of great confusion among students.
How To Find Standard Error of the Mean
The below formula is the equation for the standard error of the mean using the population standard deviation:
Where:
- = Standard error of the mean
- = Population standard deviation
- = Sample size
- = Square root of the sample size
The caveat here is that we need to know the actual population standard deviation to be able to calculate the standard error using the above formula.
Usually, populations are large, and is unlikely we have access to the entire population to calculate the population standard deviation value.
As with most cases in research, sampling a population is a much easier and less costly approach. Fortunately, there is a way to estimate the standard error of the mean using the sample standard deviation. Here is the formula:
Where:
- = Standard error of the mean
- = Sample standard deviation
- = Sample size
- = Square root of the sample size
You may have noticed that both formulas for the standard error above are quite similar. Indeed they are, the only difference being whether we know the value for population standard deviation or not.
How to Calculate Standard Error
To calculate standard error, follow these simple steps:
- Calculate or obtain your standard deviation (s for sample, σ for population)
- Count your sample size (n)
- Calculate the square root of your sample size (√n)
- Divide the standard deviation by √n to get your standard error
The standard error formula is: SE = s / √n (for sample data) or SE = σ / √n (for population data).
In practice, you can calculate standard error using:
- Excel:
=STDEV(range)/SQRT(COUNT(range)) - SPSS: Analyze → Descriptive Statistics → Explore (detailed steps below)
- R:
stderr <- function(x) sd(x)/sqrt(length(x))(detailed steps below)
Now that we know the equations for standard error, let's do some basic math and learn how to calculate standard error by hand.
Example 1: Assuming we know that the actual standard deviation of a population consisting of students taking their final exam is 7. We also took a random sample of 100 respondents from this population. Therefore we have:
Since in this standard error example we know the actual standard deviation value, we will use the first equation for the standard error above, respectively:
After plugging the numbers in the equation we have:
So, how do we interpret the standard error result in this example? It simply means that when we take a random sample of N = 100 from this population, the average difference between sample means and the population mean is 0.70.
Example 2: Now, let's assume we don't know the population standard deviation of the students taking their final exam in our school. Instead, we know the sample standard deviation (S) which let's assume is 5. The sample (N) remains unchanged, respectively 100. Therefore we have:
This time we will use the equation for standard sample deviation:
After we insert the numbers we have:
We can interpret this result as the average difference between sample means and the population mean when the sample is randomly selected and N = 100 is 0.50.
The standard error of the mean is a measure of how much difference you expect to get between a sample statistic and the population parameter and the sample means and the population mean when samples are randomly selected and of a given size.
Calculate Standard Error in SPSS
There are numerous ways to find the standard error in SPSS. In this section, we will focus on two efficient methods.
Want to follow along? Download the practice SPSS dataset from the sidebar, then launch SPSS on your computer and navigate to File → Open → Data to import the .sav file.
(1) Calculate Standard Error of the Mean in SPSS using Explore Analysis
In SPSS top menu, navigate at Analyze → Descriptive Statistics → Explore
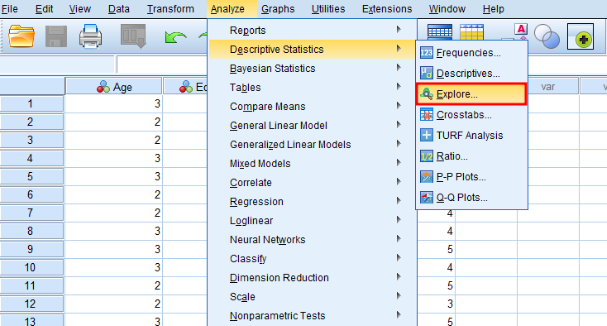
Figure 1: Navigate to Analyze → Descriptive Statistics → Explore in SPSS
On the Explore window, select a variable in the left box and click the arrow button to add it to the Dependent List.
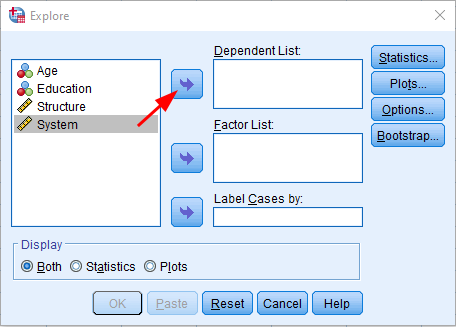
Figure 2: Select your variable and click the arrow button to add it to the Dependent List
Click the OK button to proceed with the analysis.
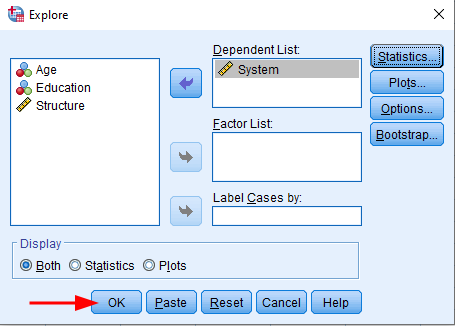
Figure 3: Click OK to execute the Explore analysis
On the Output window, scroll down to the Descriptivetable. On the Meanrow, check the Std. Errorcolumn to find the standard error value for the respective variable.
In our example, the mean for the System variable is 4.10 and the standard error is 0.081.
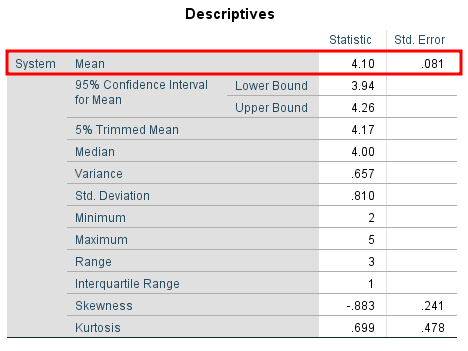
Figure 4: SPSS Descriptives table showing standard error value of 0.081 in the Std. Error column
This standard error value is a fairly low one meaning that the sample means analyzed are closely distributed around the population mean. In other words, our sample is representative of the population from where was taken.
If the standard error of the mean in your analysis is high, increasing the sample size through random selection will likely decrease the standard error value.
For instance, if your sample size is N = 50, you could increase it to N = 100 or more to lower the standard error, as seen in the side-by-side comparison below.
Pay attention to the mean and standard error of the mean in both figures.
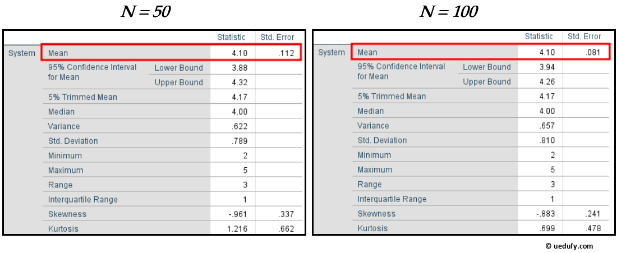
Figure 5: Comparison showing how standard error decreases as sample size increases from N=50 to N=100
(2) Find Standard Error on the Mean in SPSS using Frequency Analysis
Another way of calculating standard error in SPSS is using the Frequency analysis. In SPSS, navigate to Analysis → Descriptive Statistics → Frequencies
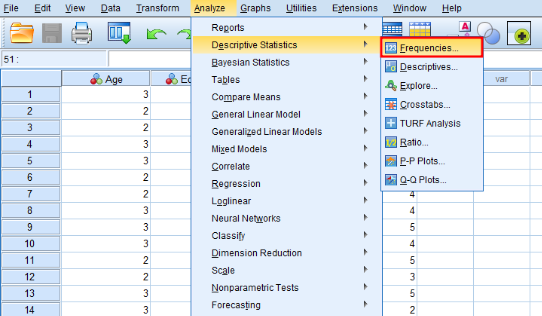
Figure 6: Navigate to Analyze → Descriptive Statistics → Frequencies in SPSS
On the Frequencies window, add the variable of interest from the left box to the Variable(s). Uncheck the Display frequency tablecheck-box and click the Statistics button.
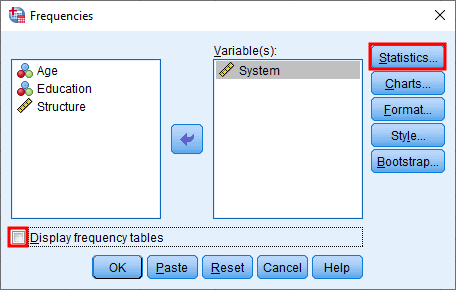
Figure 7: Add your variable to Variable(s), uncheck Display frequency table, and click Statistics
On the Statistics window, make sure the S.E. mean check-box is selected, and press the Continue button.
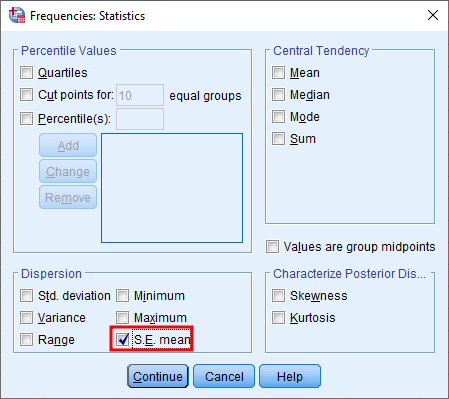
Figure 8: Select the S.E. mean checkbox and click Continue
Click on the OK in the Frequencies window to proceed with the standard error analysis.
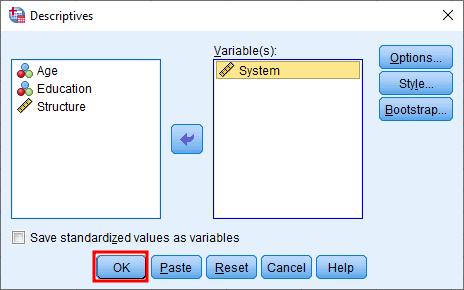
Figure 9: Click OK to run the Frequencies analysis
The standard error value will be shown in the Std. Error of Mean row of the Statistics table
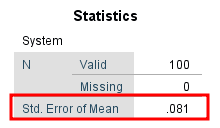
Figure 10: The standard error result appears in the Std. Error of Mean row of the Statistics table
Standard Error Calculation in Excel
To find the standard error of the mean in Excel, we simply need to translate the standard error formula into Excel syntax: standard error = standard deviation / square root of the total number of samples N.
Practice dataset available: Grab the Excel file from the sidebar to follow along with this example.
Here's how to calculate it:
- On your Excel data set, click on an empty cell anywhere on your datasheet
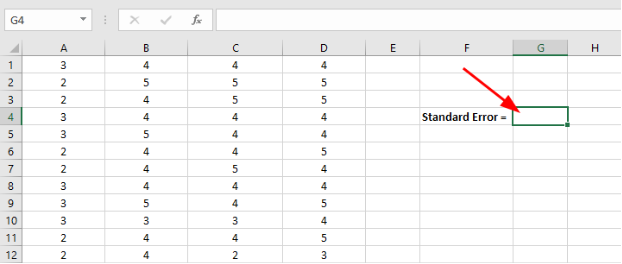
Figure 11: Click on an empty cell in Excel where you want the standard error result to appear
- Copy the standard error Excel formula below into the Insert Function field in Excel.
=STDEV(sampling range)/SQRT(COUNT(sampling range))
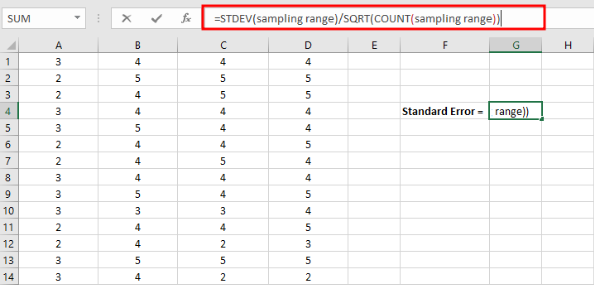
Figure 12: Enter the standard error formula: =STDEV(sampling range)/SQRT(COUNT(sampling range))
- Replace the sampling range in the standard error Excel formula with the actual range of cells you want to include in your analysis.
Once your selection is done, hit the ENTER key to complete the analysis.
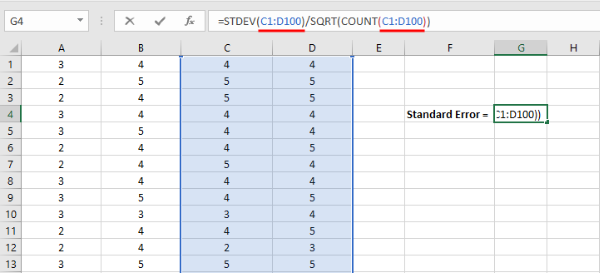
Figure 13: Replace "sampling range" with your actual cell range (e.g., A2:A101) and press ENTER
Excel will show the standard error result in the respective cell as seen in the capture below.
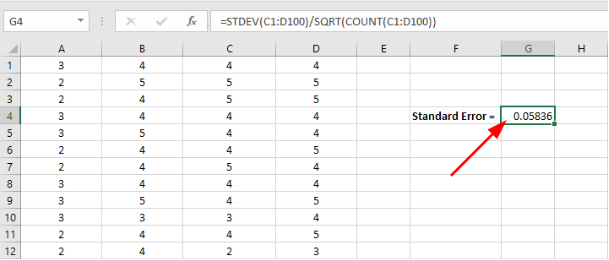
Figure 14: Excel displays the calculated standard error value in the selected cell
Standard Error Calculation In R
Finally, let’s have a look at which function we can use to find the standard error of the mean in R.
As we discussed earlier, the standard error of the mean is just the standard deviation divided by the square root of the sample size.
For this example I am going to use the same Excel dataset we used in the previous section.
Launch RStudio on your computer. On the R top menu, navigate to File → Import Dataset → From Excel.
On the Import Excel Data in R window, click on Browse and select the dataset.xlsx file you download above. Click Open then the Import button to finish importing the Excel dataset in R.
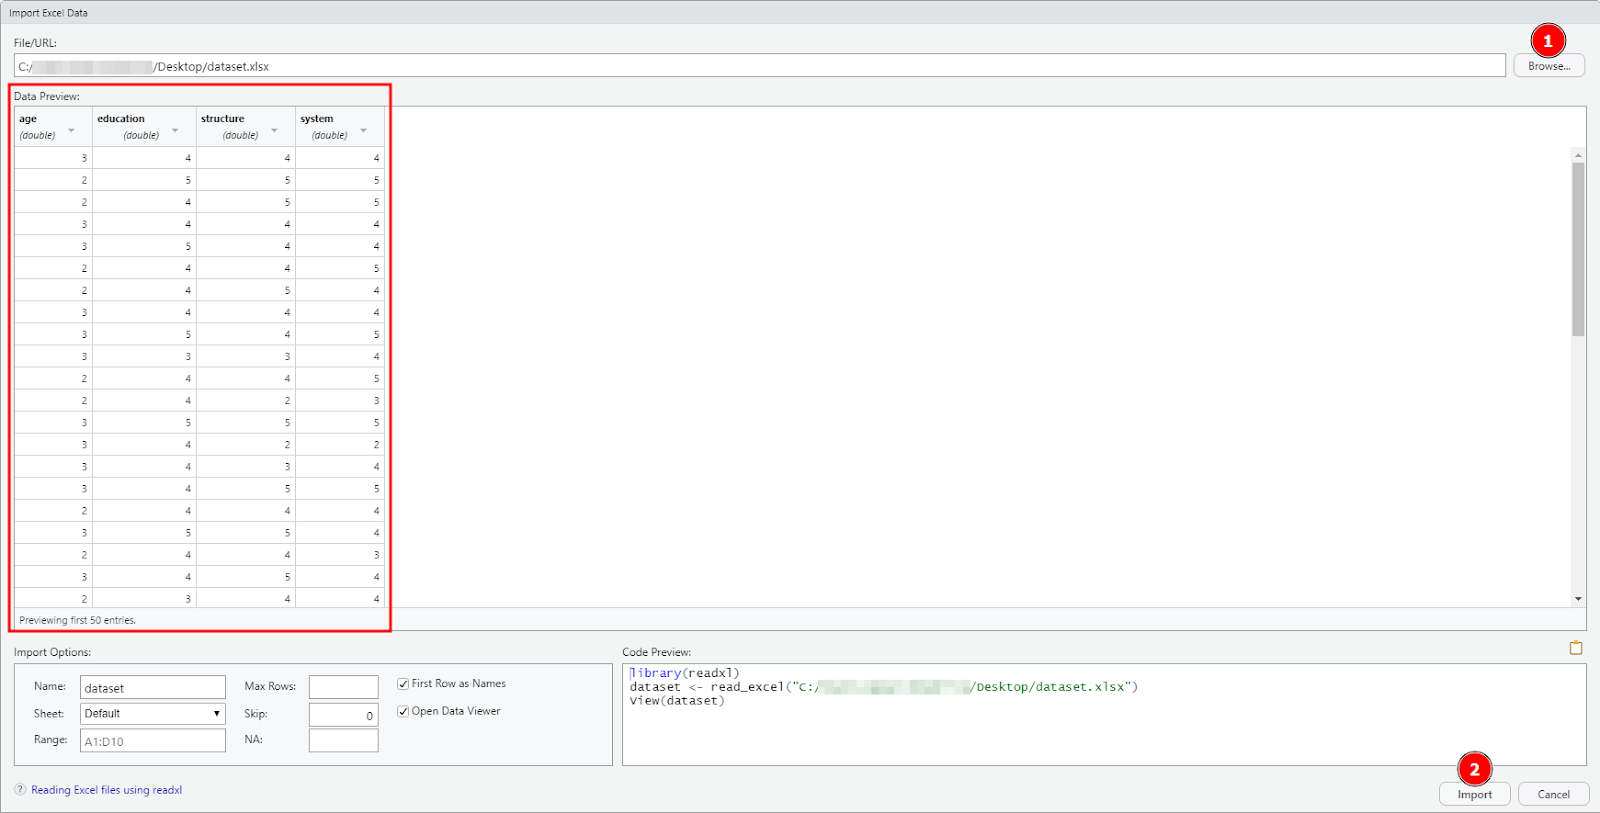
Figure 15: Click Browse to select your Excel file, then click Import to load the dataset in R
**NOTE:**R might require certain libraries to be able to import data from Excel files (.xlsx, .csv, etc.). If prompted, allow RStudio to automatically install the required dependencies.
(1) Find Standard Error in R using the Standard Error Formula
The first step is to translate the equation for standard error of the mean to a new function(x) in R. Let's call this function, e.g., stderr or any other name you want.
Type this function in the Console window in R then press ENTER.
stderr <- function(x) sd(x)/sqrt(length(x))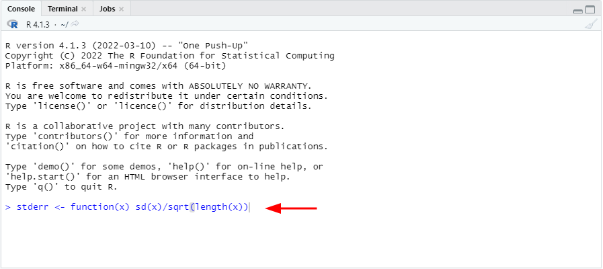
Figure 16: Create a custom stderr function in R Console
Next, let’s calculate the standard error of the mean for the age column in our dataset.
To do so, we will basically invoke the function we created and specify the dataset file and column we want to compute the standard deviation in R using the following syntax:
stderr(dataset$age)Where:
- stderr = function for standard error formula in R
- dataset = the dataset file we imported in R
- age = the column (variable) we want to find the standard error of the mean value
The standard error for the age variable in our dataset is 0.06 as seen in the capture below:
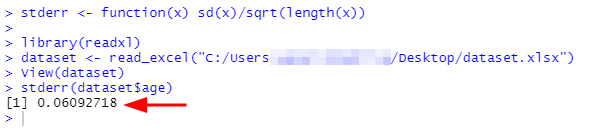
Figure 17: The stderr(dataset$age) function returns a standard error value of 0.06
(2) Find Standard Error in R using Plotrix library
This method uses the std.error() function in the Plotrix package in R. First we need to install the Plotrix library by typing the following command in the Console window in R:
install.packages('plotrix')Next, we need to call the Plotrix library in R using the following command:
library('plotrix')Finally, we can use the std.error function to calculate the standard error of the mean for the system variable in our dataset.
std.error(dataset$system)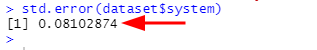
Figure 18: Using Plotrix's std.error() function to calculate standard error for the system variable
Frequently Asked Questions
Wrapping Up
The standard error of the mean measures the difference between the sample means compared with the mean of the true population. In other words, it tells us whether our sample is representative of the population from which it was taken.
If the sample analysis shows a high standard error, the best way to lower it is by increasing the sample size using random data collection.
Related Topics: If you're working with survey or questionnaire data, you might also need to assess reliability using Cronbach's Alpha in Excel or Cronbach's Alpha in SPSS to ensure your measurement scales are consistent before calculating descriptive statistics like standard error. For a complete guide to running mean, standard deviation, skewness, and kurtosis in SPSS, see our descriptive statistics in SPSS tutorial.
References
Field, A., Miles, J., & Field, Z. (2012).Discovering statistics using R. SAGE Publications.
Field, A. (2013).Discovering statistics using IBM SPSS statistics (4th ed.). SAGE Publications.
McNeil, E. (2020). Data management and visualization using R.– Songkhla: Epidemiology Unit, Faculty of Medicine, Prince of Songkla University, 2020.