You calculated descriptive statistics in Excel for your thesis. The numbers are ready: means, standard deviations, frequencies. Now you need to report them in APA 7th edition format for your results chapter.
Excel's output does not meet APA formatting guidelines. Your thesis committee expects properly formatted tables with specific decimal places, italicized symbols, and clear structure. Copying Excel tables directly into your document will result in formatting corrections from your advisor.
This guide shows you how to transform Excel descriptive statistics into perfect APA format tables. You will learn the exact formatting rules, see examples from multiple disciplines, and avoid the common mistakes that delay thesis approval.
Why APA Format Matters for Your Thesis
Your thesis committee evaluates two things: your research quality and your professional presentation. Incorrect APA formatting signals carelessness, even when your statistics are correct.
APA 7th edition provides standardized formatting so readers can quickly locate and interpret your results. Consistent formatting across thousands of research papers makes the scientific literature searchable and comparable.
Thesis advisors expect APA compliance because:
- Your work may be published in journals requiring APA format
- Formatting errors distract from your research findings
- Professional presentation demonstrates attention to detail
- Committee members review hundreds of theses using the same standard
Formatting your descriptive statistics correctly the first time prevents revision delays and demonstrates research competence.
Basic APA Formatting Rules for Descriptive Statistics
Statistical Symbols and Abbreviations
All statistical symbols must be italicized. This includes M for mean, SD for standard deviation, N for sample size, and all other statistics.
In-text format:
- The average age was 22.5 years (SD = 3.2)
- Participants were relatively young (M = 22.5, SD = 3.2)
- Sample size was adequate (N = 150)
Wrong format:
- The mean was M = 22.5 (not italicized)
- SD = 3.2 (symbol used without context outside parentheses)
- Mean = 22.5 (spell out when not in parentheses)
When statistical symbols function as part of speech in your sentence, spell out the term. Use symbols only within parentheses or in tables.
Decimal Places Guidelines
The number of decimal places depends on your measurement scale:
Two decimal places:
- Means and standard deviations for continuous data (M = 45.32, SD = 8.76)
- Correlations (r = .45)
- Effect sizes (d = 0.52)
One decimal place:
- Means and standard deviations for integer scales (Likert surveys: M = 3.5, SD = 0.8)
- Percentages (45.2%)
No decimal places:
- Frequencies (N = 150, not N = 150.00)
- Count data (25 participants)
Three decimal places:
- p-values (p = .023, p < .001)
- Some correlations in specific fields
Consistency matters more than precision. Choose appropriate decimal places based on your data's original measurement scale, then maintain that choice throughout your results section.
Reporting Means and Standard Deviations
Always report standard deviations when reporting means. The two statistics work together to describe your data distribution.
Option 1: Mean in text, SD in parentheses
The psychology majors scored an average of 105.75 on the intelligence test (SD = 15.2).
Option 2: Both in parentheses
Psychology majors demonstrated above-average intelligence (M = 105.75, SD = 15.2).
Option 3: Table format (for multiple variables)
Use tables when reporting descriptive statistics for more than three variables. Tables organize information efficiently and allow quick comparisons.
Never report a mean without its standard deviation. The mean alone provides incomplete information about your data distribution.
Excel to APA Format: Step-by-Step Workflow
Step 1: Calculate Descriptive Statistics in Excel
If you have not already calculated your descriptive statistics, use Excel's Analysis ToolPak:
- Click Data tab, then Data Analysis (far right)
- Select Descriptive Statistics from the list
- Select your data range (one column of numbers)
- Check Summary statistics
- Choose output location
- Click OK
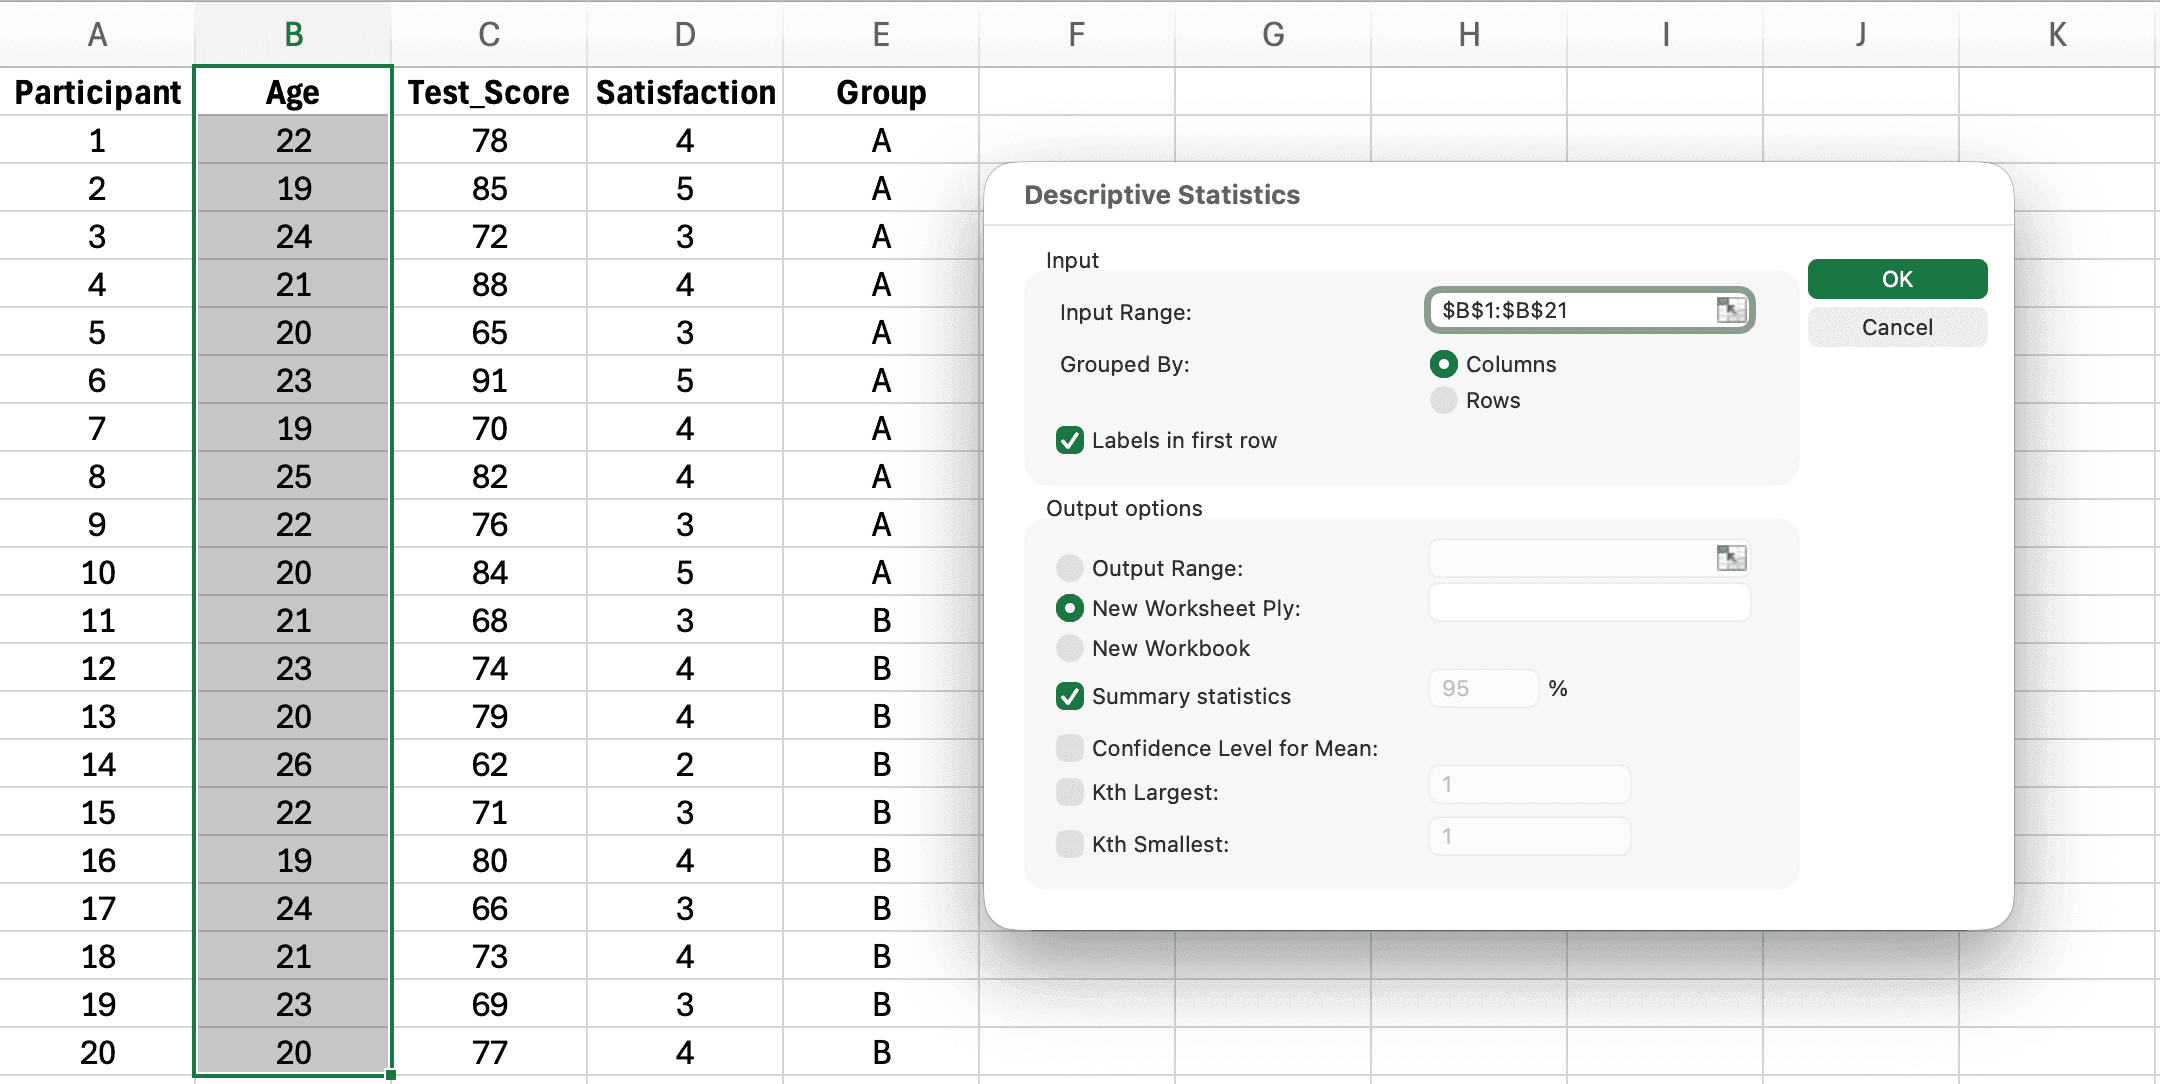 Figure 1. Data Analysis dialog with Descriptive Statistics selected and summary statistics checkbox marked
Excel provides mean, standard deviation, median, mode, range, minimum, maximum, and other statistics. You will use primarily the mean and standard deviation for APA reporting.
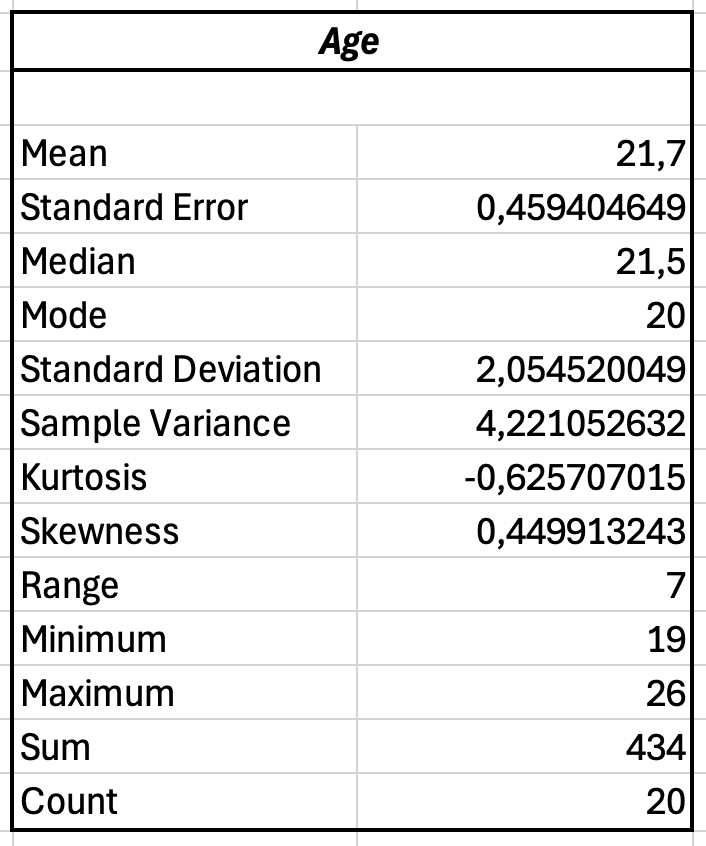 Figure 2. Excel Descriptive Statistics output showing mean, standard deviation, count, and other statistics
Step 2: Identify Statistics to Report
From Excel's output, identify these values:
- Count (your N or sample size)
- Mean (your M)
- Standard Deviation (your SD)
- Minimum and Maximum (optional, for context)
Ignore statistics not relevant to your analysis. Most thesis results chapters report N, M, and SD as the primary descriptive statistics.
Step 3: Create APA Table in Microsoft Word
Excel tables cannot be copied directly. You must create a new table in Word following APA guidelines:
Table structure:
- Table number (bold, above table): Table 1
- Table title (italics, below number): Descriptive Statistics for Student Test Scores by Teaching Method
- Column headings (sentence case, bold)
- Table body (single or double-spaced)
- Borders: Top, bottom, and below headings only
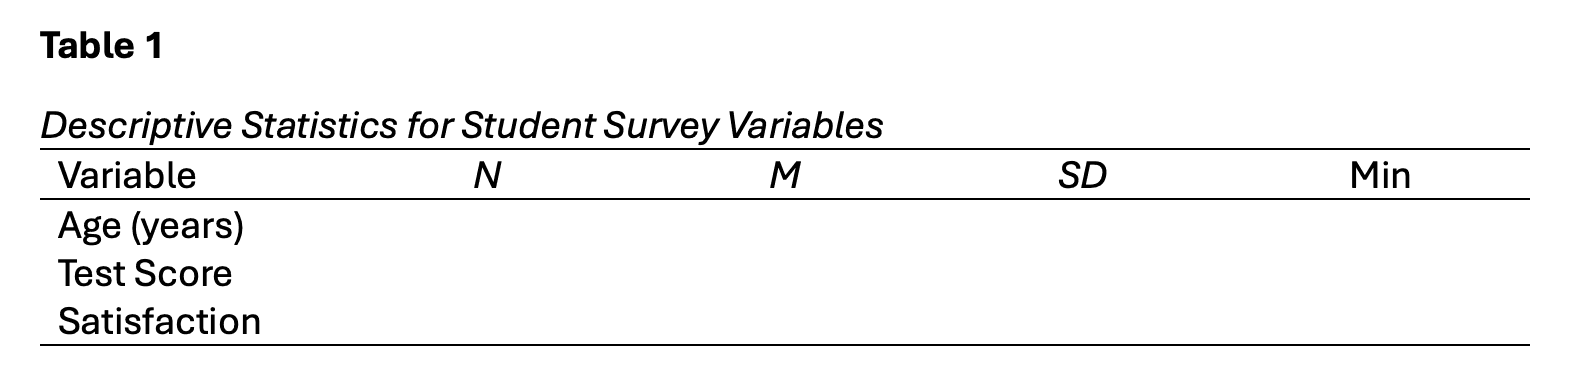 Figure 3. APA table template: bold table number, italic title, horizontal borders only, and italic statistical symbols
Creating the table in Word:
- Insert > Table (select rows and columns needed)
- Add top and bottom borders only (remove vertical borders)
- Type table number above table in bold: Table 1
- Type table title below number in italics (one line, double-spaced below number)
- Create column headings: Variable, N, M, SD (or other relevant statistics)
- Add border below headings
- Center-align numbers, left-align text labels
Step 4: Transfer Numbers from Excel to Word Table
Copy each value from Excel's descriptive statistics output:
- Locate the Mean value in Excel
- Copy and paste into your Word table's M column
- Locate the Standard Deviation in Excel
- Copy and paste into your Word table's SD column
- Copy the Count (sample size) to your N column
Round to appropriate decimal places:
- If your original data used integer scale (1-5 survey): round to one decimal
- If your original data used continuous scale: round to two decimals
Step 5: Format Statistical Symbols
After pasting numbers into your Word table:
- Select all instances of "M" and "SD" in column headers
- Apply italic formatting (Ctrl+I or Cmd+I)
- Verify N is italicized if used in column heading
- Check that all numbers align center
- Verify variable names align left
Your table now meets basic APA format requirements.
APA Table Examples for Different Research Contexts
Example 1: Single Group Descriptive Statistics
A psychology researcher measured anxiety levels in 50 undergraduate students using a validated scale.
Table 1
Descriptive Statistics for Anxiety Scores in Undergraduate Students
| Variable | N | M | SD | Min | Max |
|---|---|---|---|---|---|
| Anxiety Score | 50 | 42.8 | 12.3 | 18 | 72 |
| Age (years) | 50 | 20.5 | 2.1 | 18 | 26 |
Note. Anxiety scores measured using State-Trait Anxiety Inventory (STAI). Possible range: 20-80.
This table presents descriptive statistics for one sample group. The note below the table provides essential context about the measurement instrument and possible score range.
Example 2: Comparing Two Groups
An education researcher compared test scores between students taught using traditional methods (n = 25) versus a new instructional approach (n = 25).
Table 2
Descriptive Statistics for Test Scores by Teaching Method
| Variable | Traditional Method (n = 25) | New Method (n = 25) | ||
|---|---|---|---|---|
| M | SD | M | SD | |
| Pretest Score | 72.4 | 8.6 | 71.8 | 9.2 |
| Posttest Score | 78.2 | 7.9 | 85.6 | 6.4 |
| Gain Score | 5.8 | 4.2 | 13.8 | 5.1 |
Note. Scores represent percentage correct on 50-item mathematics test.
This format allows direct comparison between groups. Readers can immediately see that the new method group showed larger gains (M = 13.8) compared to the traditional method group (M = 5.8).
Example 3: Multiple Variables Across Groups
A business researcher examined employee satisfaction across three departments.
Table 3
Descriptive Statistics for Employee Satisfaction by Department
| Variable | Sales (n = 45) | Marketing (n = 38) | Operations (n = 52) | |||
|---|---|---|---|---|---|---|
| M | SD | M | SD | M | SD | |
| Job Satisfaction | 3.8 | 0.9 | 4.2 | 0.7 | 3.5 | 1.1 |
| Work-Life Balance | 3.2 | 1.0 | 4.0 | 0.8 | 2.9 | 1.2 |
| Compensation Satisfaction | 3.5 | 0.8 | 3.9 | 0.9 | 3.3 | 1.0 |
| Career Development | 3.6 | 0.9 | 4.1 | 0.7 | 3.4 | 1.1 |
Note. Satisfaction ratings on 5-point Likert scale (1 = Very Dissatisfied, 5 = Very Satisfied).
When comparing multiple groups across several variables, organize your table so readers can easily scan across groups for the same variable or down within a group to see all variables.
Example 4: Categorical Variables (Frequencies and Percentages)
A healthcare researcher reported demographic characteristics of study participants.
Table 4
Participant Demographics (N = 150)
| Characteristic | n | % |
|---|---|---|
| Gender | ||
| Male | 68 | 45.3 |
| Female | 82 | 54.7 |
| Education Level | ||
| High School | 35 | 23.3 |
| Bachelor's Degree | 78 | 52.0 |
| Graduate Degree | 37 | 24.7 |
Note. Percentages may not sum to 100.0% due to rounding.
For categorical data, report frequencies (n) and percentages. Note lowercase italic n for subgroup sample sizes versus uppercase italic N for total sample.
Reporting Descriptive Statistics in Text vs. Tables
Decide whether to present statistics in text or tables based on the amount of information.
When to Use Text (In-Line Reporting)
Use text for one to three statistics:
Participants (N = 150) were predominantly female (n = 82, 54.7%) with a mean age of 34.5 years (SD = 8.2, range = 22-58).
The intervention group (n = 48) scored higher on the posttest (M = 85.6, SD = 6.4) than the control group (n = 50, M = 78.2, SD = 7.9).
In-text reporting works well for key demographics or when emphasizing specific comparisons in your narrative.
When to Use Tables
Use tables for four or more variables or when comparing multiple groups:
- Descriptive statistics for all study variables
- Comparing means across three or more groups
- Reporting demographics with multiple categories
- Presenting correlation matrices
- Any data requiring readers to compare values
Tables organize complex information efficiently. They allow readers to locate specific values quickly without searching through paragraphs.
Combining Text and Tables
Reference tables in your text, but do not repeat all table contents:
Table 1 presents descriptive statistics for all study variables. As shown in Table 1, participants in the intervention group demonstrated higher posttest scores (M = 85.6, SD = 6.4) compared to the control group (M = 78.2, SD = 7.9).
Highlight key findings in text while directing readers to the full table for details.
Common APA Formatting Mistakes and How to Fix Them
Mistake 1: Not Italicizing Statistical Symbols
Wrong:
- M = 45.6, SD = 8.2 (not italicized)
- Table columns labeled M and SD without italics
Correct:
- M = 45.6, SD = 8.2 (italicized)
- Column headers show M and SD in italics
Fix: After creating your table in Word, select all M and SD symbols and apply italic formatting.
Mistake 2: Too Many or Too Few Decimal Places
Wrong:
- M = 3.456789 (excessive precision for Likert scale)
- M = 3 (insufficient precision)
- Inconsistent decimals: M = 3.5, SD = 0.82
Correct:
- M = 3.5, SD = 0.8 (one decimal for Likert scales)
- M = 45.32, SD = 8.27 (two decimals for continuous data)
- Consistent decimal places throughout
Fix: Determine appropriate decimal places based on original measurement scale. Apply consistently to all similar statistics.
Mistake 3: Reporting Mean Without Standard Deviation
Wrong:
- The average score was 78.5.
- Participants averaged M = 34.2 years of age.
Correct:
- The average score was 78.5 (SD = 6.4).
- Participants averaged M = 34.2 years of age (SD = 8.1).
Fix: Always report SD when reporting M. These statistics work together to describe distribution.
Mistake 4: Using Excel Tables Directly
Wrong:
- Copying Excel's Descriptive Statistics output into Word
- Pasting Excel table with gridlines and Excel formatting
Correct:
- Creating new APA-formatted table in Word
- Manually transferring numbers with proper formatting
Fix: Use Excel only for calculations. Build APA tables from scratch in Word using proper structure (see comparison below).
Mistake 5: Incorrect Table Structure
Wrong:
- No table number or title
- Vertical borders in table
- Table title not in italics
- Inconsistent spacing
Correct:
- Bold table number (Table 1)
- Italic title below number
- Horizontal borders only (top, bottom, below headings)
- Consistent spacing throughout
Fix: Follow APA 7th edition table formatting guidelines exactly. Reference official APA sample tables.
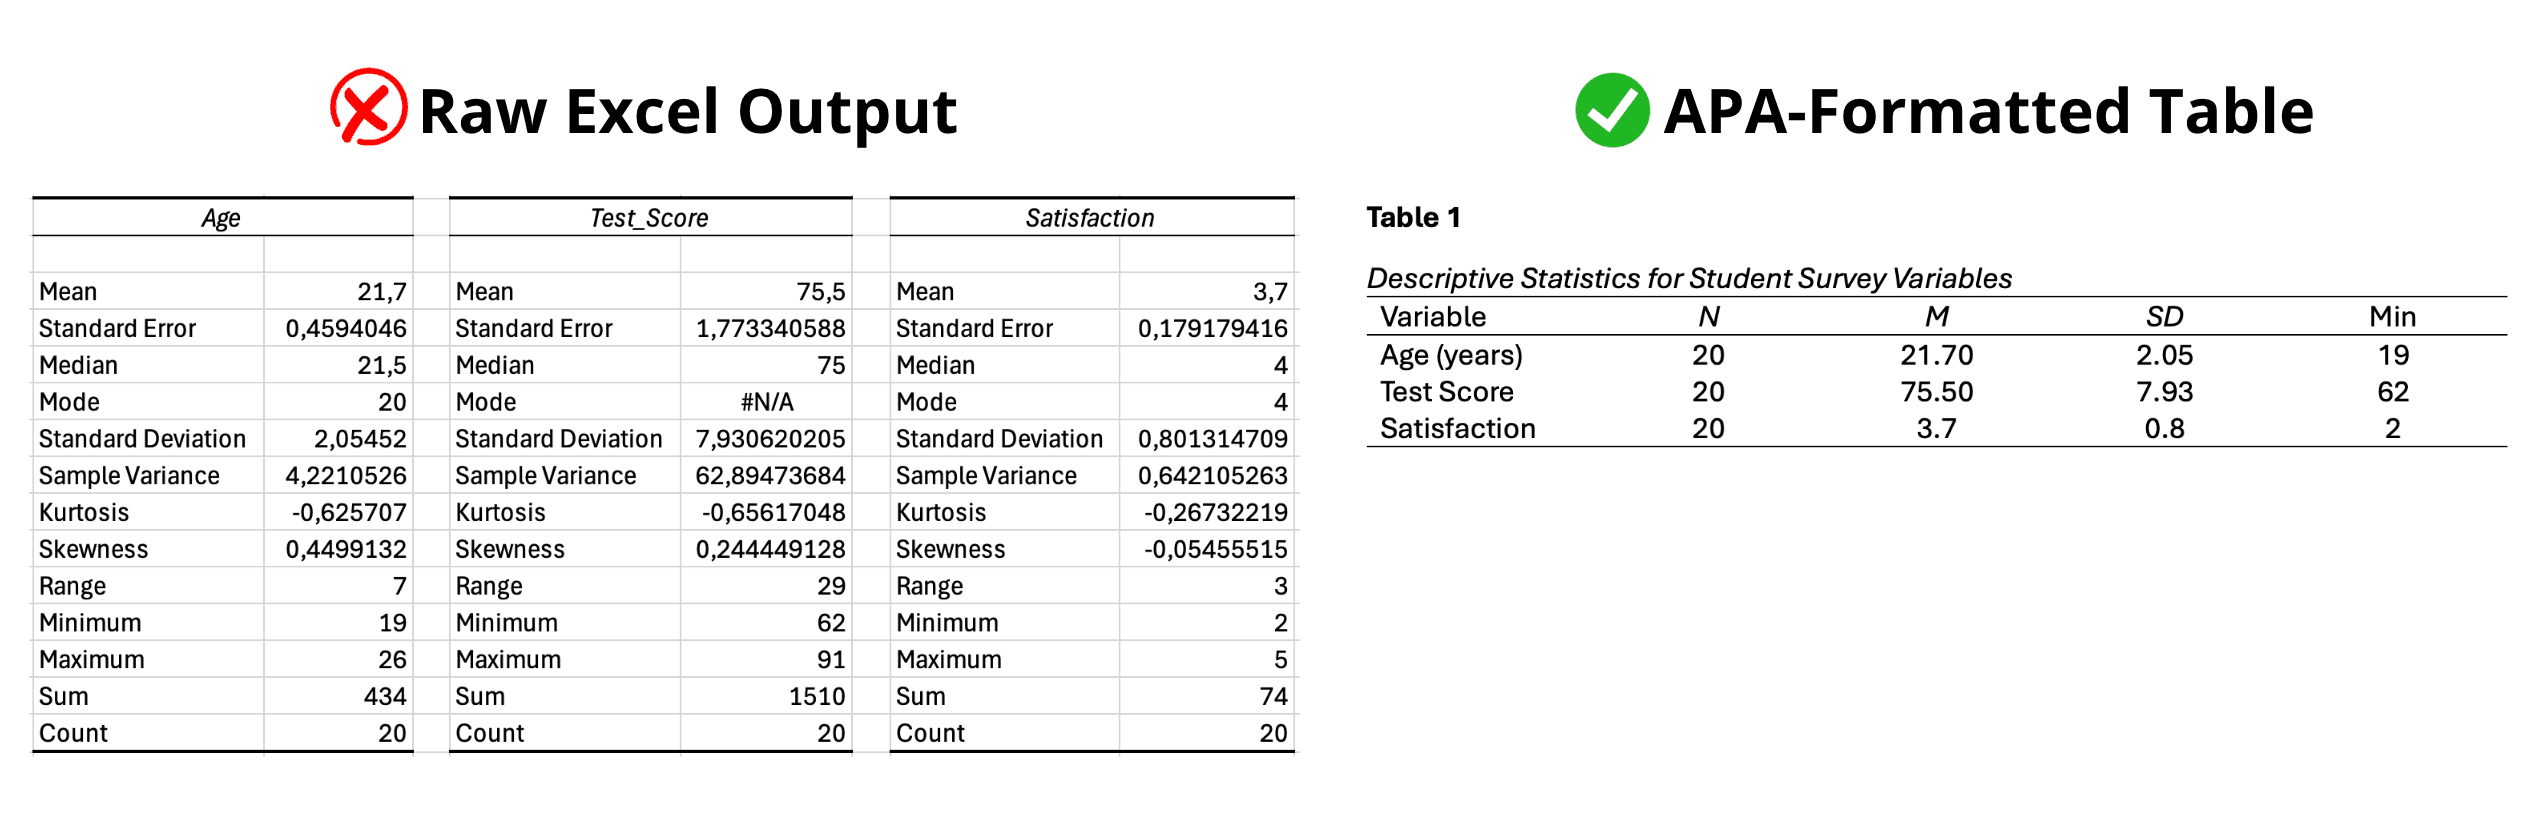 Figure 4. Common mistake: copying raw Excel output (left) instead of creating a properly formatted APA table (right)
Mistake 6: Misusing Sample Size Notation
Wrong:
- Using N for subgroup sizes
- Not reporting sample sizes at all
- Inconsistent notation (n vs. N)
Correct:
- N = total sample size (uppercase italic)
- n = subgroup sample size (lowercase italic)
- Report both when presenting group comparisons
Fix: Use uppercase N for overall sample, lowercase n for groups. Italicize both.
Mistake 7: Missing Table Notes
Wrong:
- No explanation of abbreviations
- No context for scales used
- Missing important details about data
Correct:
- General note explaining measurement instruments
- Specific notes for special cells (use superscript letters)
- Probability notes for significance (use asterisks)
Fix: Add note below table explaining measures, scales, or important context readers need.
Discipline-Specific Considerations
Psychology and Social Sciences
Psychology research typically reports:
- Demographics (age, gender, education)
- Scale scores (M, SD for validated instruments)
- Reliability coefficients (Cronbach's alpha)
- Skewness and kurtosis for distribution shape
Table 1 shows that participants scored an average of 42.8 on the State-Trait Anxiety Inventory (SD = 12.3), indicating moderate anxiety levels. The depression scale showed adequate internal consistency (α = .87).
Education Research
Education studies commonly report:
- Student demographics and background
- Pretest and posttest scores
- Gain scores or change scores
- Group comparisons (intervention vs. control)
As shown in Table 2, students in the new instructional method group demonstrated significantly larger gains (M = 13.8, SD = 5.1) compared to the traditional instruction group (M = 5.8, SD = 4.2).
Business and Management
Business research frequently presents:
- Employee or organizational demographics
- Survey scale scores (job satisfaction, engagement)
- Performance metrics
- Response rates and sample characteristics
Participating organizations (N = 45) employed an average of 234 workers (SD = 156, range = 50-850). Employee satisfaction across departments averaged 3.8 on a 5-point scale (SD = 0.6).
Healthcare and Medical Research
Medical studies typically report:
- Patient demographics and clinical characteristics
- Health outcome measures
- Treatment compliance rates
- Diagnostic test results
Patients (N = 150) had a mean age of 58.4 years (SD = 12.6) and mean disease duration of 6.8 years (SD = 4.2). Blood pressure measurements averaged 145/92 mmHg (SD = 18/12).
Adapt your descriptive statistics reporting to match conventions in your field while maintaining APA formatting standards.
Pre-Submission Checklist for APA Descriptive Statistics
Before submitting your thesis, verify each item:
Table Structure:
- Table number in bold above table
- Table title in italics below number, title case
- Clear column headings in sentence case
- Horizontal borders only (top, bottom, below headings)
- No vertical borders
- Consistent spacing (single or double throughout table)
Statistical Formatting:
- All M, SD, N, n symbols italicized
- Appropriate decimal places (1-2 for M and SD, 3 for p-values)
- SD reported whenever M is reported
- Consistent decimal places within each statistic type
- Sample sizes reported for all groups
Content Accuracy:
- Numbers transferred correctly from Excel
- Calculations verified (means, SDs match raw data)
- Sample sizes add up correctly across groups
- Percentages sum to 100% (or note if rounding causes deviation)
Table Notes:
- General note explains measurement instruments if needed
- Specific notes clarify unusual entries (use superscript letters)
- Probability notes included if significance testing shown (use asterisks)
Consistency Across Document:
- Table numbering sequential (Table 1, Table 2, etc.)
- Same decimal place rules throughout results section
- Consistent terminology (same variable names in text and tables)
- All tables referenced in text before they appear
Professional Presentation:
- No Excel formatting remnants (gridlines, alternating row colors)
- Clean, readable font (Times New Roman 12pt typical)
- Tables fit within page margins
- Page breaks do not split tables awkwardly
Review this checklist for each descriptive statistics table before your thesis defense. Formatting corrections after committee review delay graduation.
Frequently Asked Questions
Next Steps
You have reported your descriptive statistics correctly in APA format. The next phase of your results chapter presents inferential statistics testing your hypotheses.
Start here if you need to analyze your survey data: How to Analyze Survey Data in Excel: Complete Guide
Choose your statistical test:
Report reliability for your scales:
Improve your data quality:
- Common Mistakes in Survey Analysis (Excel) and How to Fix Them
- Descriptive Statistics in Excel: The Ultimate Guide
Your descriptive statistics provide the foundation for all subsequent analyses. Accurate APA formatting ensures your committee focuses on your research findings rather than formatting errors.
References
American Psychological Association. (2020). Publication manual of the American Psychological Association (7th ed.). American Psychological Association.
Appelbaum, M., Cooper, H., Kline, R. B., Mayo-Wilson, E., Nezu, A. M., & Rao, S. M. (2018). Journal article reporting standards for quantitative research in psychology: The APA Publications and Communications Board task force report. American Psychologist, 73(1), 3-25.
Morgan, S. E., Reichert, T., & Harrison, T. R. (2002). From numbers to words: Reporting statistical results for the social sciences. Allyn & Bacon.
Nicol, A. A. M., & Pexman, P. M. (2010). Presenting your findings: A practical guide for creating tables (6th ed.). American Psychological Association.